
While there never seems to be a shortage of market-related concerns keeping advisors up at night, two of the more present issues today are: rising interest rates and an increase in public markets’ price volatility.
One potential reprieve from both situations is: investing in private real assets, especially those that are essential to the functioning of a modern society (e.g. assets such as farmland, housing, materials and utilities – all of which have inelastic demand). Historically, these assets have been less impacted by changes in interest rates or increases in market volatility.
Observe private real assets’ standard deviation over the trailing 30-year period compared to the S&P 500 Index and Bloomberg Aggregate Bond Index.
Standard Deviation
Private Real Assets, US Large Cap Stocks and US Core Bonds
Trailing 30-Years (6/30/1993 - 6/30/2023)
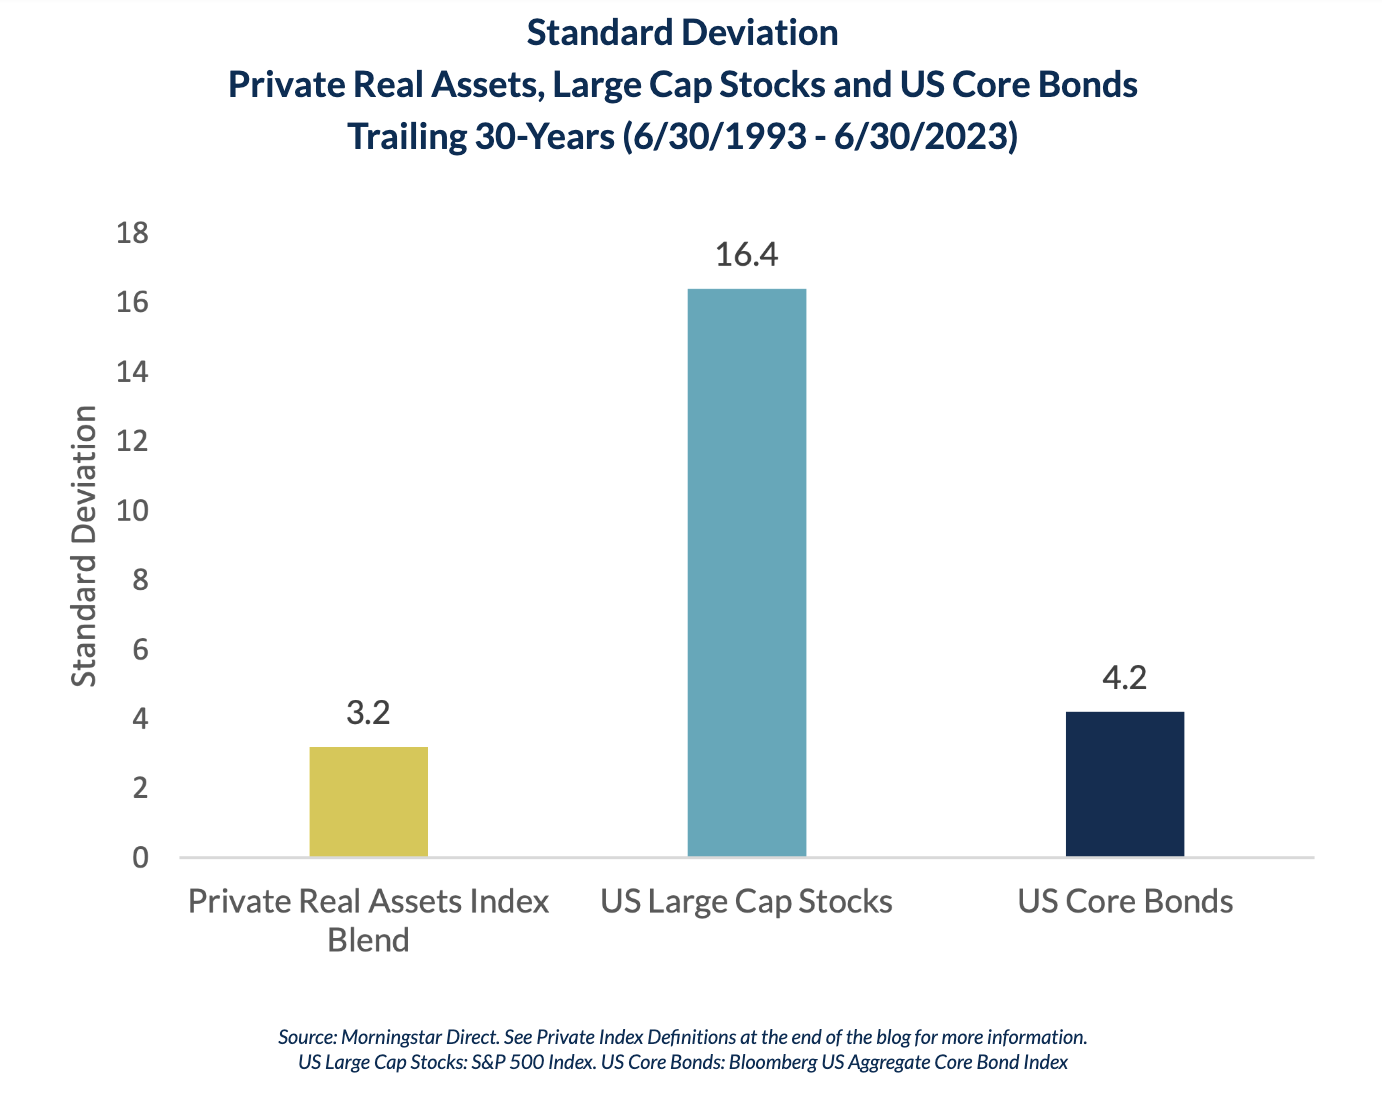
Source: Morningstar Direct. See Private Index Definitions at the end of the blog for more information.
US Large Cap Stocks: S&P 500 Index. US Core Bonds: Bloomberg US Aggregate Core Bond Index
Private real assets’ volatility has been roughly one-quarter that of large-cap equities, and less than US Core Bonds. However, the annualized return for real assets was 9.7% over this same period, nearly matching the 9.8% return for large-cap equities, and more than double the 4.5% return for core bonds. The combination of S&P 500-like returns with less volatility than core bonds has resulted in superior risk-adjusted performance metrics.
Sharpe Ratio
Private Real Assets, US Large Cap Stocks and US Core Bonds
Trailing 30-Year (6/30/1993 - 6/30/2023)
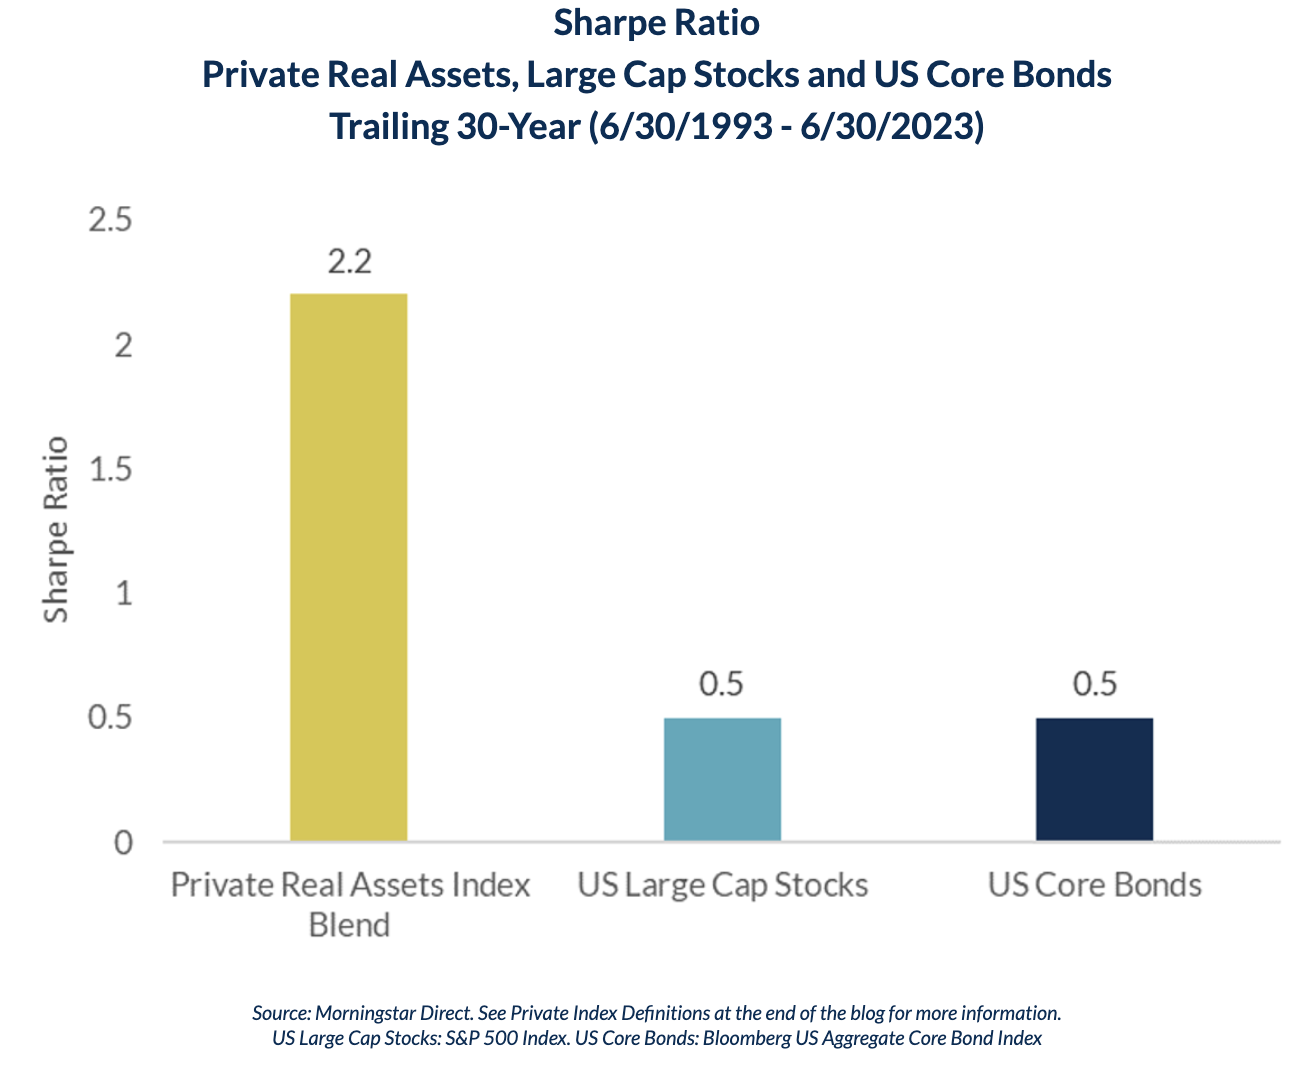
Source: Morningstar Direct. See Private Index Definitions at the end of the blog for more information.
US Large Cap Stocks: S&P 500 Index. US Core Bonds: Bloomberg US Aggregate Core Bond Index
All three of the aforementioned asset classes have been under pressure recently as interest rates have risen dramatically, but historically, private real assets have had much lower maximum drawdowns.
This has partially been driven by the inelastic demand for real assets. Consumers will typically cut back on entertainment, travel, luxury merchandise and many other discretionary items during periods of market distress, but discontinuing their electricity, grocery shopping, natural gas/heat, highway tolls, etc. typically are not realistic options.
Maximum Drawdown
Private Real Assets, US Large Cap Stocks and US Core Bonds
Trailing 30-Year (6/30/1993 - 6/30/2023)
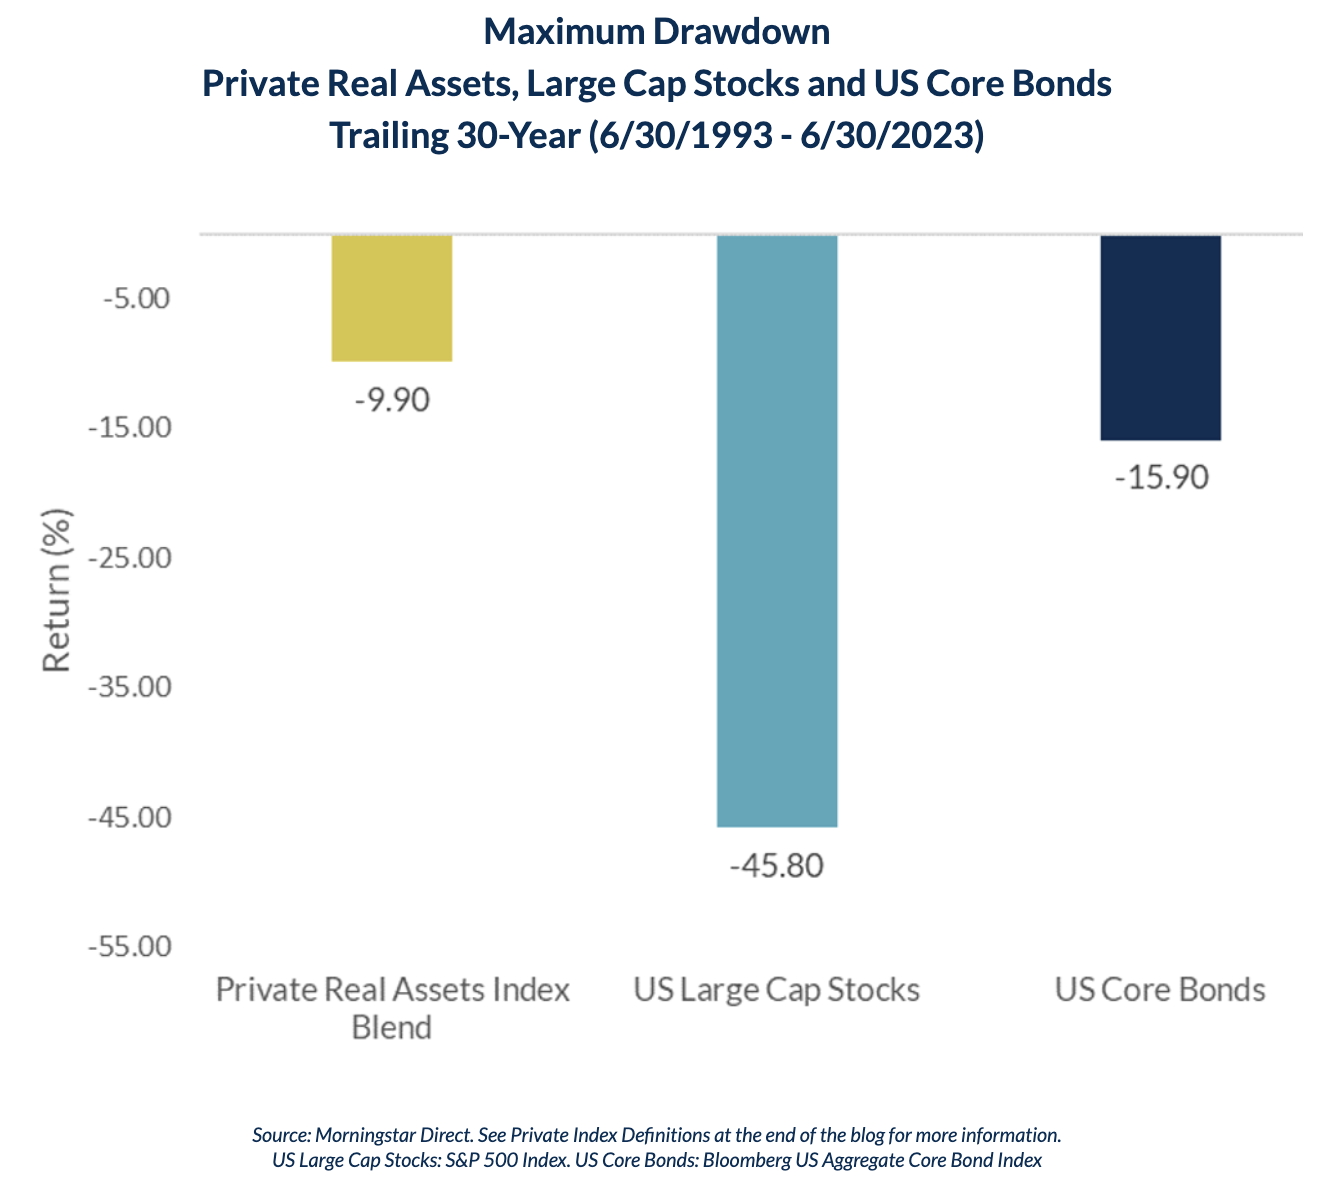
Source: Morningstar Direct. See Private Index Definitions at the end of the blog for more information.
US Large Cap Stocks: S&P 500 Index. US Core Bonds: Bloomberg US Aggregate Core Bond Index
Lastly, many real assets are typically less sensitive to increases in interest rates. Some real assets such as on-campus student housing, utility companies and toll roads often have contractual cash flows along with escalators that are tied to inflation. Farmland is another good example of an asset that can potentially benefit from inflation, since increased crop prices typically result in higher farm revenue and higher farmland values.
The graph below shows the yield on the 10-year Treasury. There have been three obvious trough-to-peak periods since 2011 when the yield on the 10-year Treasury rose considerably.
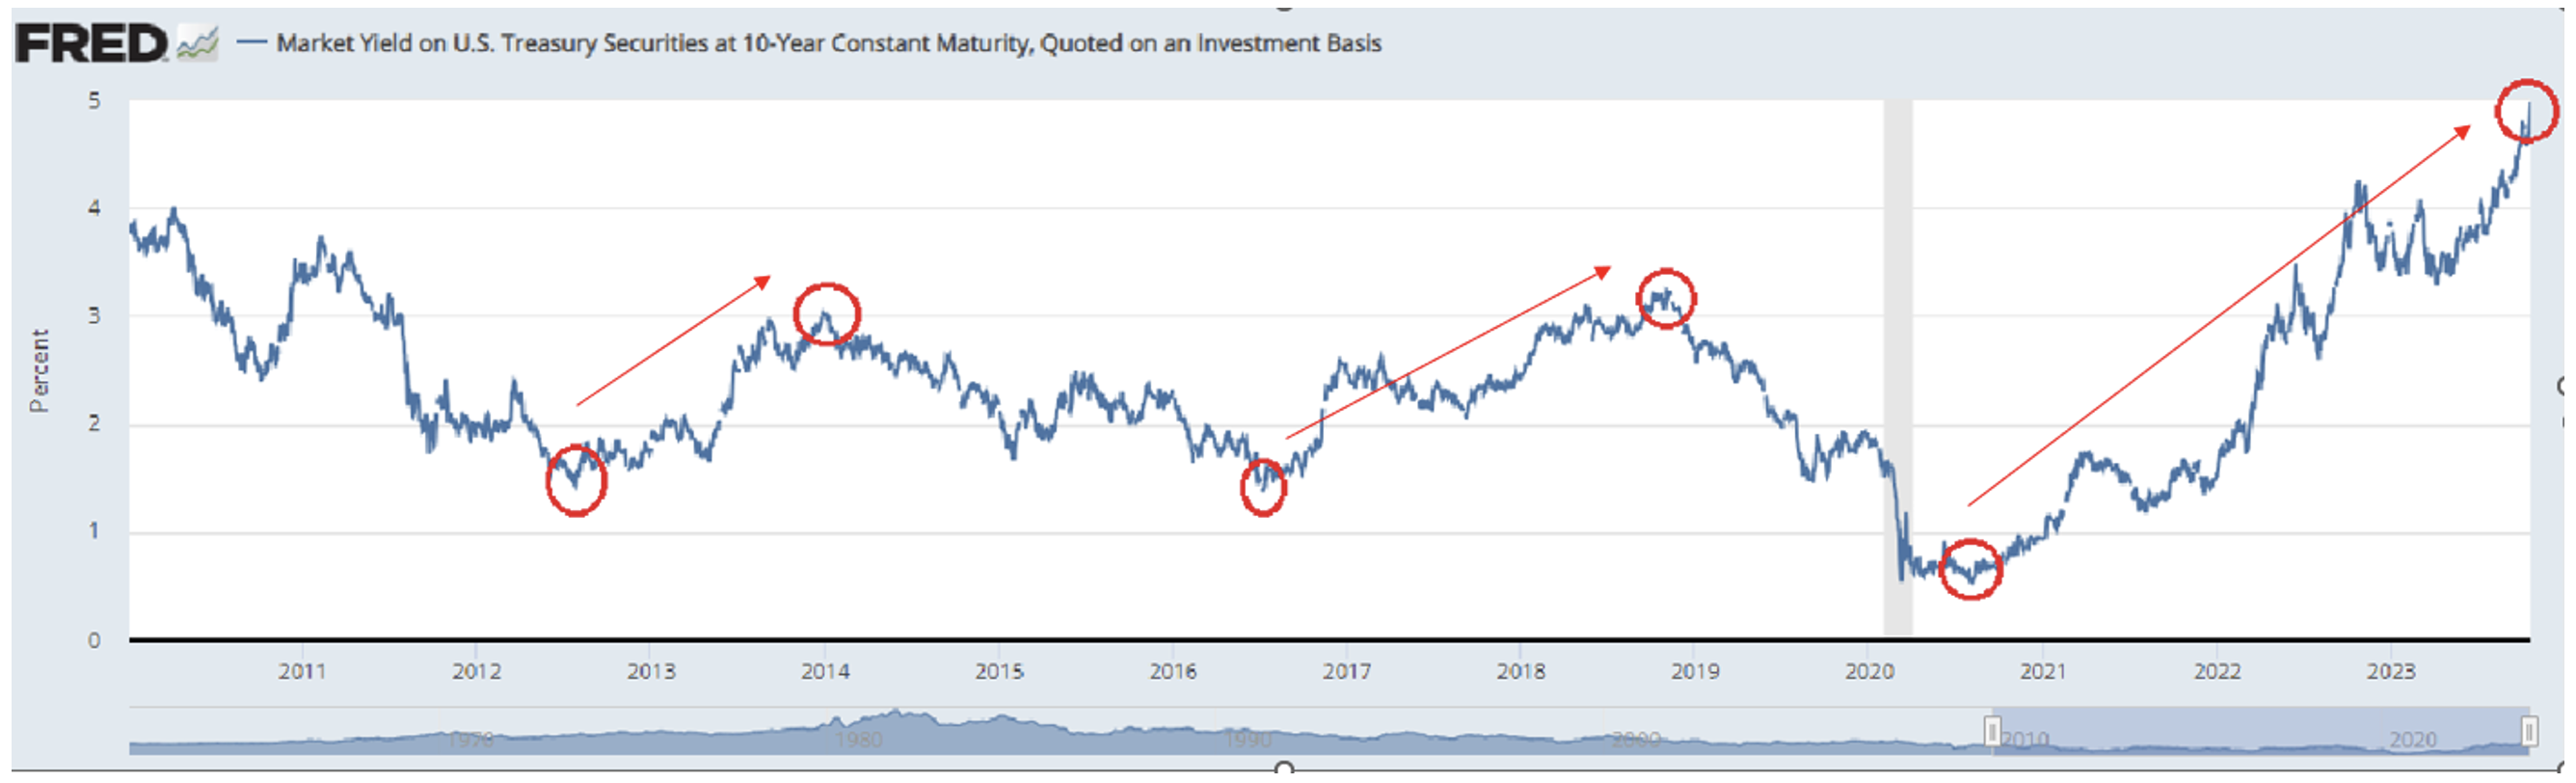
In all three of these periods, private real assets dramatically outperformed US core bonds.
Rising Interest Rate Periods (Trough to Peak)
Private Real Assets vs US Core Bonds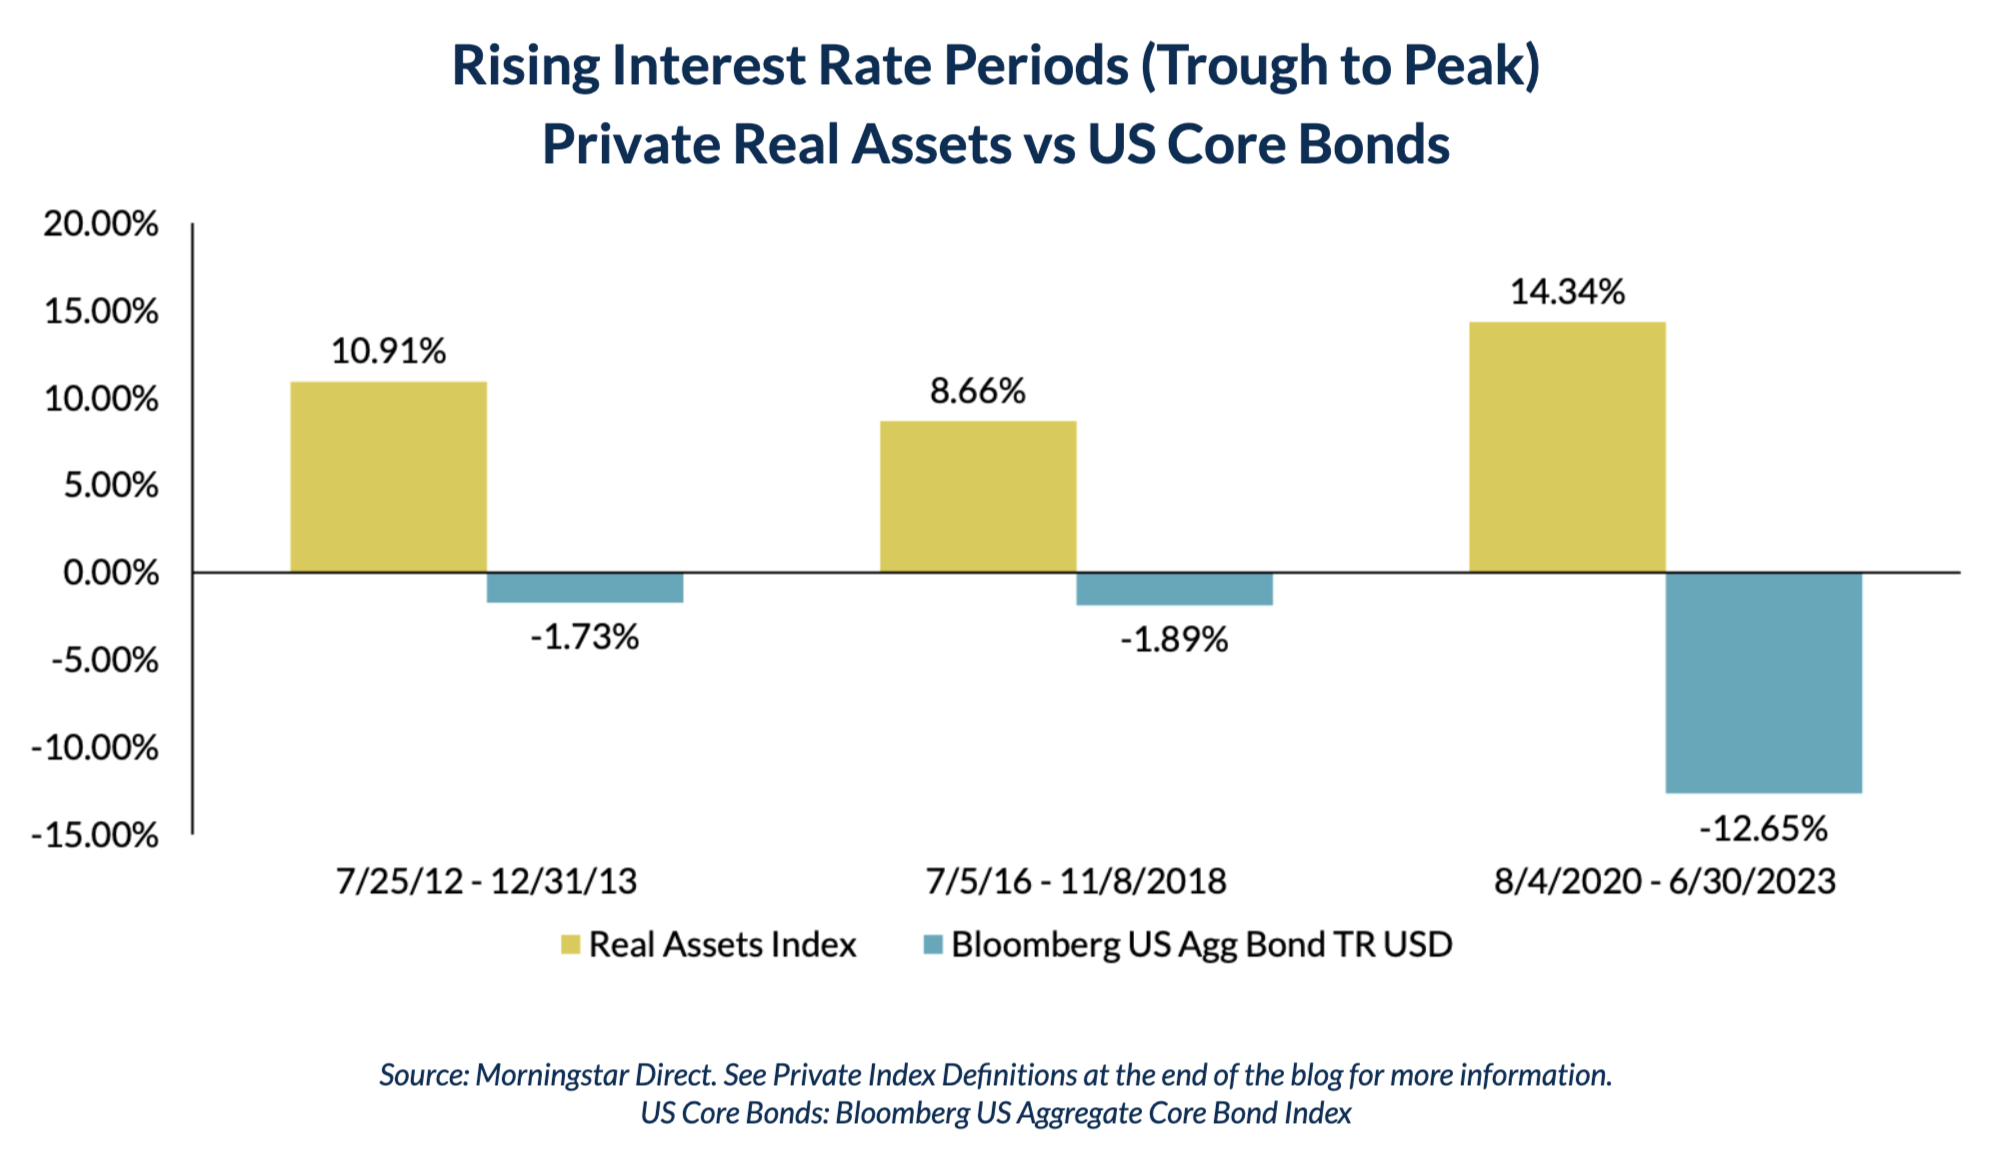
Source: Morningstar Direct. See Private Index Definitions at the end of the blog for more information.
US Core Bonds: Bloomberg US Aggregate Core Bond Index
In conclusion, due to the less-volatile nature of private real asset investments coupled with their positive absolute performance in recent periods of rising interest rates, we believe there is a strong case to be made for including private real assets alongside mainstream asset classes within client portfolios.
If you are not already subscribed to our insights, we invite you to fill out the form below to be notified when we release new information on real assets investing.
DEFINITIONS & DISCLOSURES
Note that there is a substantial lag in private real asset index performance reporting (particularly for infrastructure), thus 6/30/2023 is the most-recent available data.
Standard Deviation: A measurement of the dispersion of returns around the mean return. As the standard deviation increases, the annual variation in returns also increases.
Sharpe Ratio is calculated using the annualized total return, the annualized risk-free rate (i.e. Short Term U.S. Treasury Bonds) and the annualized standard deviation since inception. The Sharpe Ratio is a measure of risk-adjusted returns.
Maximum Drawdown: The maximum observed loss from a peak to a trough of a portfolio, before a new peak is attained. Maximum drawdown is an indicator of downside risk over a specified time period.
INDEX DEFINITIONS:
Private Real Assets Index Blend: represented by a 50% allocation to Private Real Estate, and a 16.66% allocation each to Private Infrastructure, Private Timberland, and Private Farmland.
Private Real Estate: NCREIF Property Index (NPI) measures the appraised values of over 7,000 core commercial operating properties (apartment, hotel, industrial, office and retail) acquired on behalf of tax-exempt institutions and held in a fiduciary environment. Each property’s return is weighted by its market value.
Private Infrastructure: JP Morgan OECD Core/Core+ Infrastructure (1/1/1990 – 3/31/2008) is a data series designed to be representative of stable (core/core-plus) mature long-life infrastructure assets in OECD countries and is constructed from cash-flows of approximately 50 mature infrastructure assets in the U.S. and EU-15 countries. The following infrastructure asset types are represented in the dataset: Electricity Distribution, Natural Gas Distribution, Water and Waste Water Distribution, Ports, Airports and Toll Roads. MSCI Global Quarterly Infrastructure Asset Index (4/1/2008 - forward) measures the equity performance of infrastructure assets globally. Nine infrastructure asset owners contribute asset valuations for 123 individual infrastructure assets with a gross asset value of $61 Billion. Returns are time-weighted and currency movements are excluded from return metrics.
Private Farmland: The NCREIF Farmland Index is a quarterly time series composite return measure of investment performance of a large pool of individual farmland properties acquired in the private market for investment purposes only. All properties in the Farmland Index have been acquired, at least in part, on behalf of tax-exempt institutional investors - the great majority being pension funds. As such, all properties are held in a fiduciary environment.
Private Timberland: The NCREIF Timberland Index is a quarterly time series composite return measure of investment performance of a large pool of individual timber properties acquired in the private market for investment purposes only. All properties in the Timberland Index have been acquired, at least in part, on behalf of tax-exempt institutional investors - the great majority being pension funds. As such, all properties are held in a fiduciary environment.
US Large Cap Stocks: S&P 500 Index measures the performance of 500 widely held stocks in US equity market. Standard and Poor's chooses member companies for the index based on market size, liquidity and industry group representation. Included are the stocks of industrial, financial, utility, and transportation companies. Since mid 1989, this composition has been more flexible and the number of issues in each sector has varied. It is market capitalization-weighted.
US Core Bonds: Bloomberg US Agg Bond Index is an unmanaged index representing more than 5,000 taxable government, investment-grade corporate and mortgage-backed securities, and is generally considered a barometer of the US bond market.
Past performance cannot predict future results. Index performance does not reflect fund performance and it is not possible to invest directly in and index.